Game logs through Oct 26, 2026 · 162 players
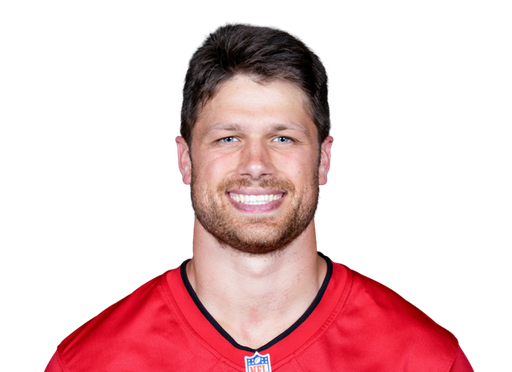
Cade Otton TE
TB vs ATL ·
 3.5 Receptions
O +111U -142
- Season avg
- 2.7
- Graph avg
- 3.2
- Graph median
- 3.00–7
- Over the close
- 50%5/10
-
2025

-
-
-
2026

-
-

-
-
-

-
-

Closing line = market consensus, from the 2025 season on.
Splits all logged games · over 3.5
- Home 56% 10/18 · avg 4.6
- Away 37% 7/19 · avg 2.9
- vs ATL 33% 1/3 · avg 4.0
Alt lines last 10 · how often Over cleared
- O 1.5 80% 8/10
- O 2.5 70% 7/10
- O 3.5 Today 40% 4/10
- O 4.5 20% 2/10
- O 5.5 10% 1/10
Past results counted against these lines. Research only, not a projection.
Matchup radar · TEs vs ATL
What ATL allowed to TEs per game over its last 10 games. Rank 1 = allowed the most of 32 defenses.
- Rec Yds75.7#2
- Receptions7.2#2
- Targets9.7#2
- Yds/Target7.8#9
- Rec TD0.5#12
TEs vs ATL · 2026
Each main TE who faced ATL this season: receptions in that game against their own average in their other games.
| Date | Player | Result | Their avg | Diff |
|---|---|---|---|---|
| Oct 25 |
 George Kittle | 8 | 4.3 | +85% |
| Oct 18 |
 Colston Loveland | 6 | 3.3 | +80% |
| Oct 11 |
 Mark Andrews | 4 | 3.7 | +9% |
| Oct 05 |
 Juwan Johnson | 6 | 3.3 | +80% |
| Sep 24 |
Tucker Kraft | 4 | 4.2 | -4% |
| Sep 20 |
Tommy Tremble | 1 | 3.0 | -67% |
| Sep 13 |
Pat Freiermuth | 5 | 3.0 | +67% |
Target zones
Share of charted pass attempts by depth (deep = more than 15 air yards) and direction, with yards per attempt. Shading follows the share.
TB offense
| Depth | Left | Middle | Right |
|---|---|---|---|
| Deep | 6%9.9 yds | 4%13.4 yds | 6%8.5 yds |
| Short | 34%5.1 yds | 14%7.2 yds | 36%5.3 yds |
Share of TB pass attempts, last 10 games · Yds/att
ATL defense
| Depth | Left | Middle | Right |
|---|---|---|---|
| Deep | 9%7.6 yds#27 | 3%19.0 yds#4 | 8%9.4 yds#22 |
| Short | 32%6.4 yds#8 | 14%6.6 yds#22 | 33%5.3 yds#19 |
Throws ATL faced, last 10 games · rank 1 = most yds/att allowed · Yds/att allowed
His targets
| Depth | Left | Middle | Right |
|---|---|---|---|
| Deep | 2%0.0 yds | 4%9.0 yds | 4%0.0 yds |
| Short | 11%9.8 yds | 27%5.3 yds | 51%8.6 yds |
Last 10 games · Yds/target
Target share · TB 2026
Each pass-catcher’s share of TB targets this season, with games and targets.
| # | Player | GP | Tgt/g | Total | Share |
|---|---|---|---|---|---|
| 1 | Emeka Egbuka WR | 6 | 8.2 | 49 | 25.6% |
| 2 | Chris Godwin Jr. WR | 7 | 4.9 | 34 | 19.9% |
| 3 | Cade Otton TE | 7 | 4.3 | 30 | 15.3% |
| 4 | Ted Hurst III WR | 6 | 3.8 | 23 | 12.7% |
| 5 | Bucky Irving RB | 7 | 3.3 | 23 | 12.4% |
| 6 | Tez Johnson WR | 7 | 2.1 | 15 | 8.4% |
| 7 | Kenny Gainwell RB | 7 | 2.4 | 17 | 8.0% |
| 8 | Payne Durham TE | 2 | 1.0 | 2 | 3.4% |
| 9 | Jalen McMillan WR | 1 | 1.0 | 1 | 2.9% |
| 10 | Kameron Johnson WR | 7 | 0.3 | 2 | 1.1% |
Game log · 10 games
| Date | Wk | Opp | Receptions | vs 3.5 | Close | Snaps |
|---|---|---|---|---|---|---|
| 2026-10-25 | 7 | @ CAR | 0 | Under | 3.5 | 56 (89%) |
| 2026-10-18 | 6 | vs PIT | 1 | Under | 3.5 | 74 (100%) |
| 2026-10-08 | 5 | @ DAL | 3 | Under | 3.5 | 66 (92%) |
| 2026-10-04 | 4 | vs GB | 4 | Over | 2.5 | 60 (95%) |
| 2026-09-27 | 3 | vs MIN | 3 | Under | 3.5 | 65 (94%) |
| 2026-09-20 | 2 | vs CLE | 5 | Over | 2.5 | 58 (89%) |
| 2026-09-13 | 1 | @ CIN | 3 | Under | 3.5 | 56 (98%) |
| 2026-01-03 | 18 | vs CAR | 7 | Over | 4.5 | 64 (96%) |
| 2025-12-28 | 17 | @ MIA | 4 | Over | 3.5 | 65 (97%) |
| 2025-12-21 | 16 | @ CAR | 2 | Under | 1.5 | 60 (94%) |
Pick’em lines: Underdog 3.5
Hit rate counts past games above today’s line. Drag the line on the chart to count against any other number. It describes history and is not a prediction or a pick. Game logs and snap counts from games already played. Target zones from play-by-play. Closing lines: market consensus. Lines: DraftKings, updated 5m ago.
 Add KarmaEdge to your Home Screen